1. Introduction to relevant definitions
(1) Background signal: It can be understood as some clutter signals still output in the system when there is no signal input. For example, if the light source is not lit in the integrating sphere, and the sphere is sealed, the luminous flux read out at this time should be 0, but in fact, some very small signals can still be read out. Such signals can be considered as background signals.
(2) Detection limit: refers to the minimum limit that the equipment or measurement method can measure. When using the device, in order to avoid the interference of the background signal, it is usually necessary to calibrate the zero first, that is, filter out the background signal. In other words, all signals smaller than the background signal will be filtered out, that is, the background signal can be understood as the detection limit of this device.
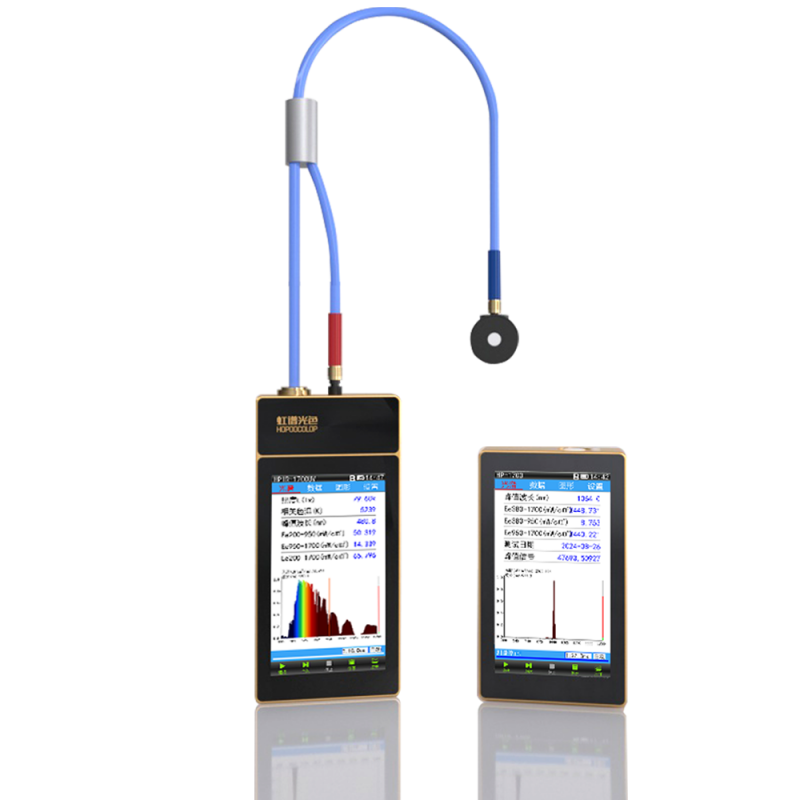
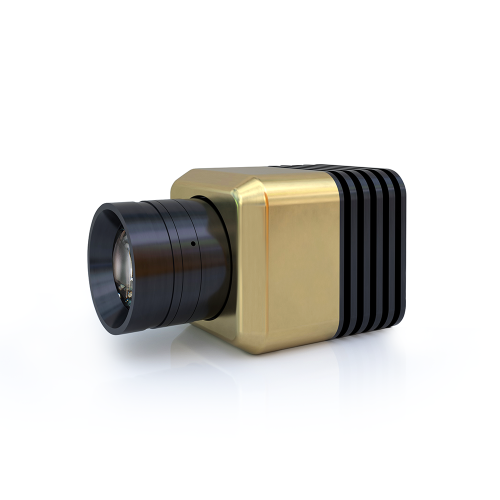
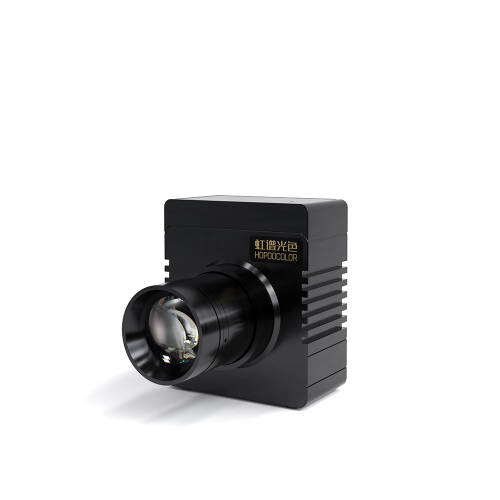
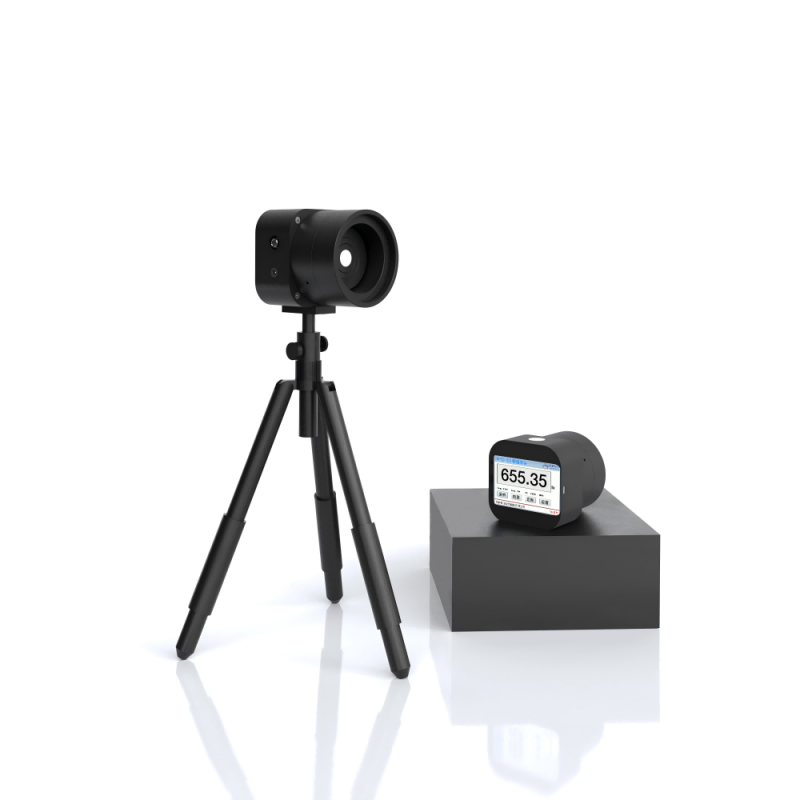
(3) Standard lamp: various electric light sources used to reproduce and maintain the unit and value transfer of luminosity and radiation measurement. They are standard gauges in optical radiometry, i.e. a calibrated luminaire that emits a fixed luminous flux under calibrated conditions (specific current or voltage).
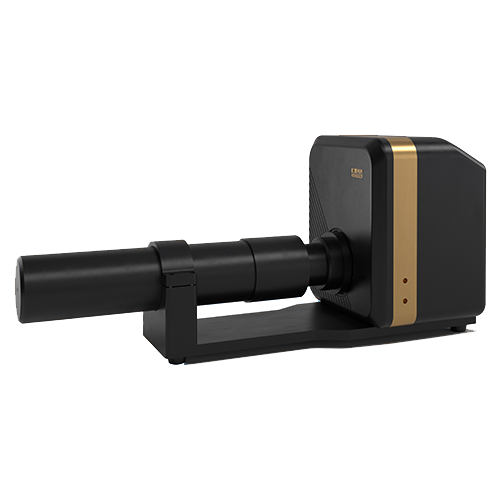
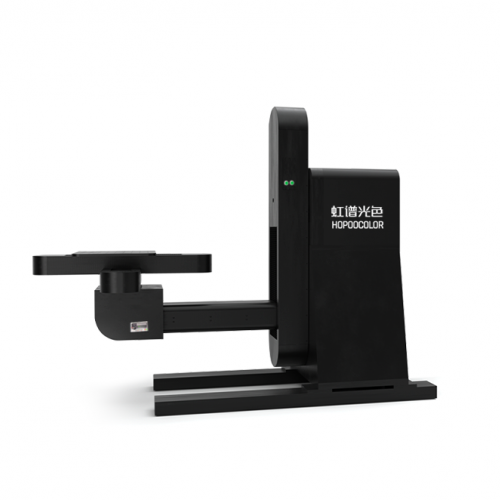
2 Measurement methods
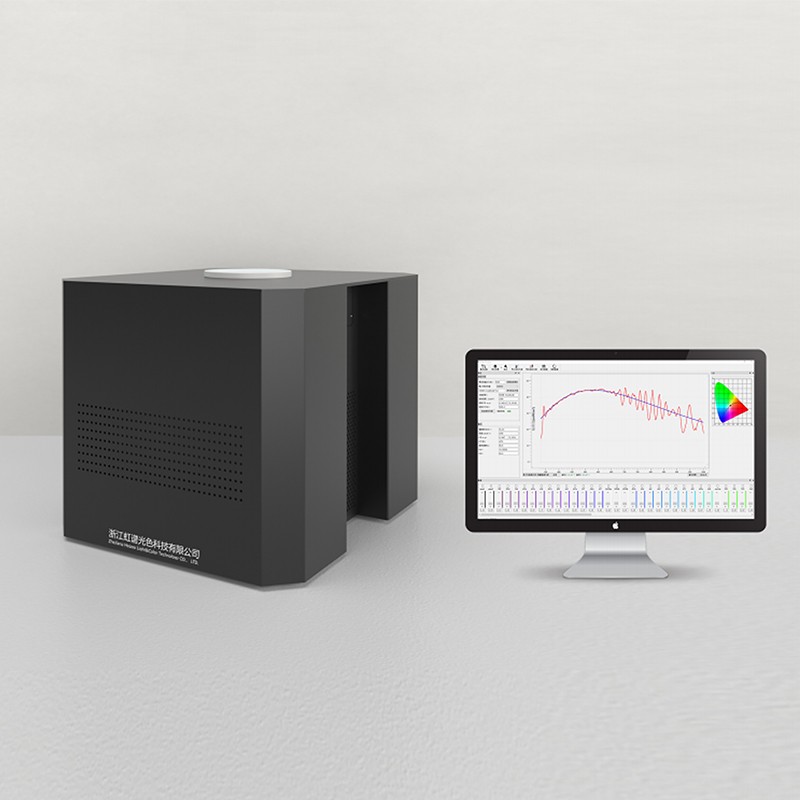
Unlike the goniophotometer, the integrating sphere is measured by a relative comparison method. The actual measured value is calculated by comparing it with the standard lamp, so it is generally necessary to use the standard lamp to calibrate first. Calibration means using standard lamps to allow equipment to establish a standard for comparison with actual measured values.
In fact, the calibrated equipment is checked with different beacons, and the characteristic values obtained still have certain errors. The error is roughly divided into two forms, one is the error of a fixed value, as shown in the figure. The y-axis in the figure represents the size of the error. It can be seen that the error of each test is 10, which is an ideal embodiment of a fixed numerical error.
Another type of error is the percentage error, which can be expressed in the form of X±2%, which can be simply understood as the following figure. Mathematically, it can be represented by a straight line of y=ax+b.
That is to say, using 1, 2, 3, and 4 beacon lights to check the calibrated equipment, an error trend curve can be roughly obtained. That is, within the luminous flux range of 1-4 beacons, the error is controllable.


 浙公网安备 33010602008509号